
How Business Dashboards Turn Operational Data Into Real-Time Management Insights
Businesses generate large amounts of operational data across sales, finance, customer service, marketing, and other departments but may struggle to understand what is happening across the organisation. Relying on spreadsheets, separate systems, manual reports, and delayed information can make it difficult for managers to identify important changes, monitor performance, and respond to problems quickly. Business dashboards bring relevant data together and present it through clear metrics and visual reports that help managers understand performance and act on useful information. Effective business dashboard development in Kenya should therefore focus on business requirements, relevant metrics, reliable data sources, timely or real-time updates, and the information managers need to make better decisions.
What Is a Business Dashboard?
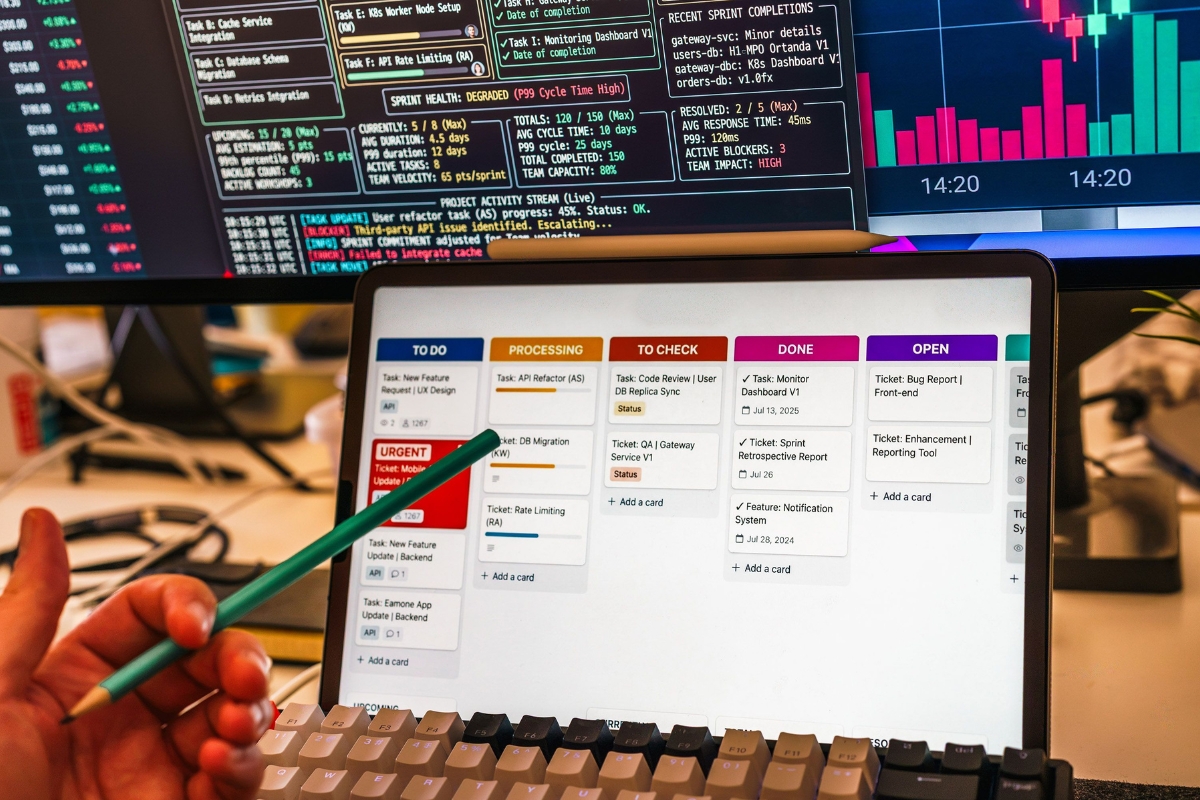
A business dashboard is a digital interface that brings important business information into one accessible view, helping users monitor performance and understand what is happening across different functions. Instead of searching through separate spreadsheets, systems, or reports, users can view selected metrics and operational information through visual elements that make relevant changes easier to identify. Effective business dashboard development in Kenya focuses on presenting the right information in a clear, useful, and timely format that supports everyday management decisions:
1. What Does a Business Dashboard Do?
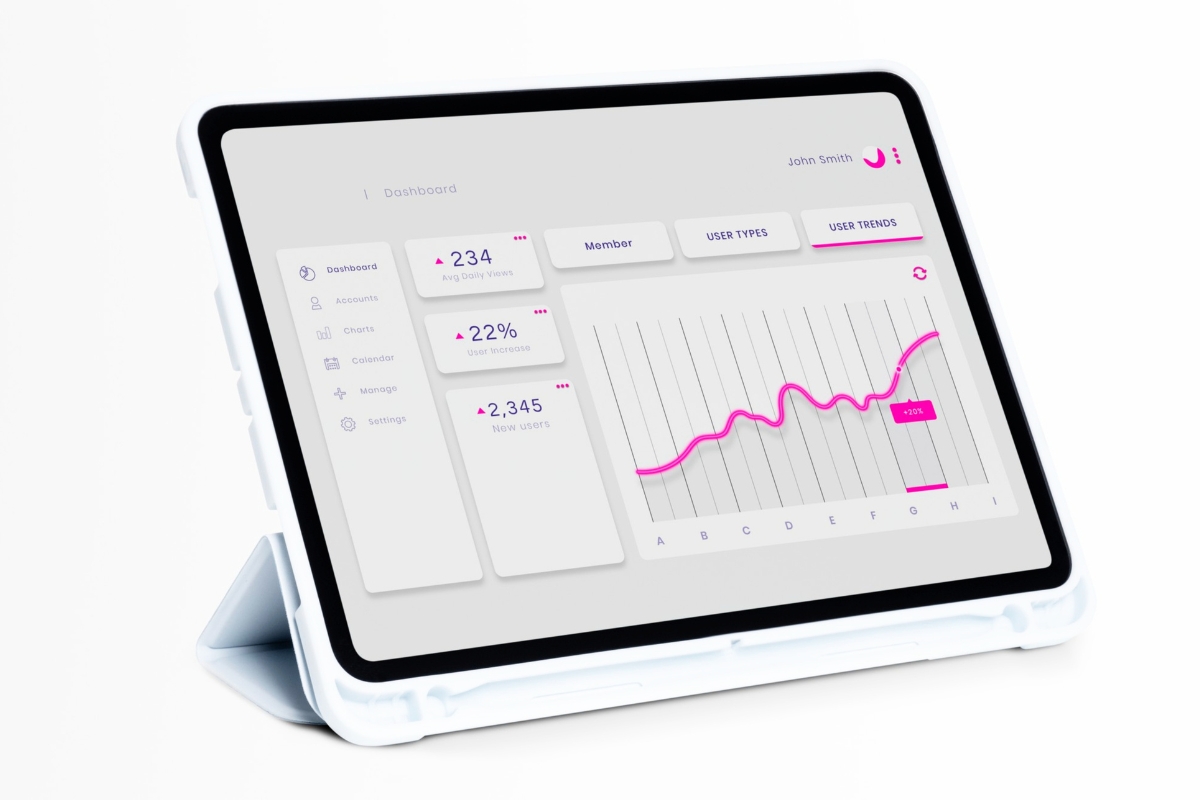
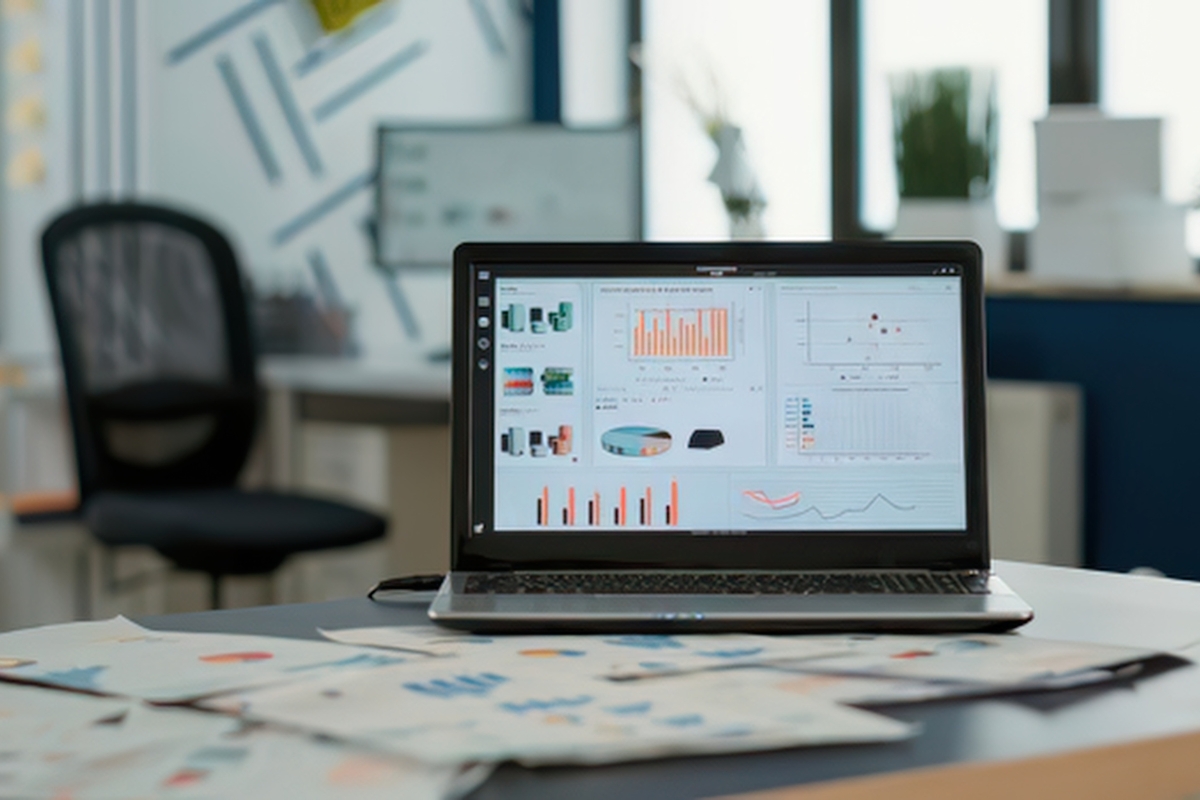
A business dashboard collects relevant information from selected data sources and presents it through metrics, tables, charts, graphs, status indicators, and other visual elements. It can organise information into a single view so users can monitor selected activities without checking multiple records or manually combining data. The dashboard can also highlight important changes, trends, targets, and exceptions that require attention.
2. What Information Can a Business Dashboard Display?
A business dashboard can display information based on the functions and processes a business needs to monitor. This may include sales, customers, operations, finances, employees, inventory, enquiries, bookings, workflows, website activity, service delivery, transactions, and other operational information. The information displayed should reflect the business requirements and help authorised users monitor the areas that matter most to their responsibilities.
3. How Is a Business Dashboard Different From a Standard Report?
A standard report often presents information for a specific period and may require users to review a new report when they need updated figures. A dashboard provides ongoing visibility into selected information and can update when the underlying data changes, depending on how the system is designed. This makes dashboards more suitable for continuously monitoring operational activities, performance indicators, and changing business conditions.
4. Who Uses Business Dashboards?
Business dashboards can support different users depending on their responsibilities and the information they are authorised to access. Business owners and managers may use them to monitor overall performance, while department heads and operations teams can track activities within specific functions. Finance teams, sales teams, customer service teams, and other authorised users can also access dashboards designed around the information they need.
5. What Makes a Business Dashboard Useful?
A useful dashboard presents relevant data through clear metrics and an understandable structure rather than overwhelming users with unnecessary information. It should use reliable data sources, provide timely updates, control access appropriately, and make important information easy to interpret. Most importantly, the information should help users identify what requires attention and take appropriate action.
Why Do Businesses Need Real-Time Management Insights?
Businesses can lose valuable opportunities when managers receive important operational information only after a delay. Timely insights can make it easier to recognise changes, investigate problems, and respond while issues are still manageable. Business dashboards can support this visibility by bringing selected operational information together and making it available to authorised users as business activities change:
1. Reducing Delays in Accessing Business Information
Managers may need current information to understand what is happening across sales, operations, finance, customer service, or other departments. When employees must wait for manually prepared reports, important information may reach decision-makers after the situation has already changed. A dashboard can provide a more direct way to access selected information and reduce unnecessary delays.
2. Identifying Problems Earlier
Current operational information can help managers notice falling performance, process delays, unusual activity, missed targets, or bottlenecks sooner. Instead of discovering an issue during a weekly or monthly review, users can monitor relevant indicators as information becomes available. Earlier visibility gives the business more time to investigate the cause and take corrective action.
3. Improving Management Visibility
Businesses often have activities taking place across multiple departments, systems, locations, or processes at the same time. A dashboard can bring selected information from these areas into a broader management view, making it easier to understand how different activities are performing. This wider visibility can help managers identify relationships between operational areas that may be difficult to see when information remains separated.
4. Supporting Faster Decisions
Managers can make decisions more quickly when the information required to assess a situation is readily available. Instead of waiting for employees to collect figures from different sources, users can review relevant metrics and supporting information through the dashboard. This can help businesses respond faster to operational changes, customer needs, performance issues, and emerging opportunities.
5. Monitoring Business Performance Continuously
Periodic reports provide useful information at specific points in time, but they may not provide enough visibility for activities that change frequently. Dashboards allow managers to monitor selected indicators continuously, such as sales activity, enquiries, bookings, inventory levels, financial figures, or workflow progress. Regular visibility helps users track whether performance is moving in the expected direction and identify changes that may require attention.
6. Reducing Dependence on Manual Reporting
Manual reporting can require employees to collect information from different sources, combine records, check figures, prepare calculations, and format the final report. Repeating these tasks takes time and can introduce inconsistencies when information is copied or updated manually. A well-designed dashboard can bring information from connected data sources into a central view, reducing repetitive reporting work while giving users more direct access to the information they need.



How Does Business Dashboard Development in Kenya Support Local Businesses?
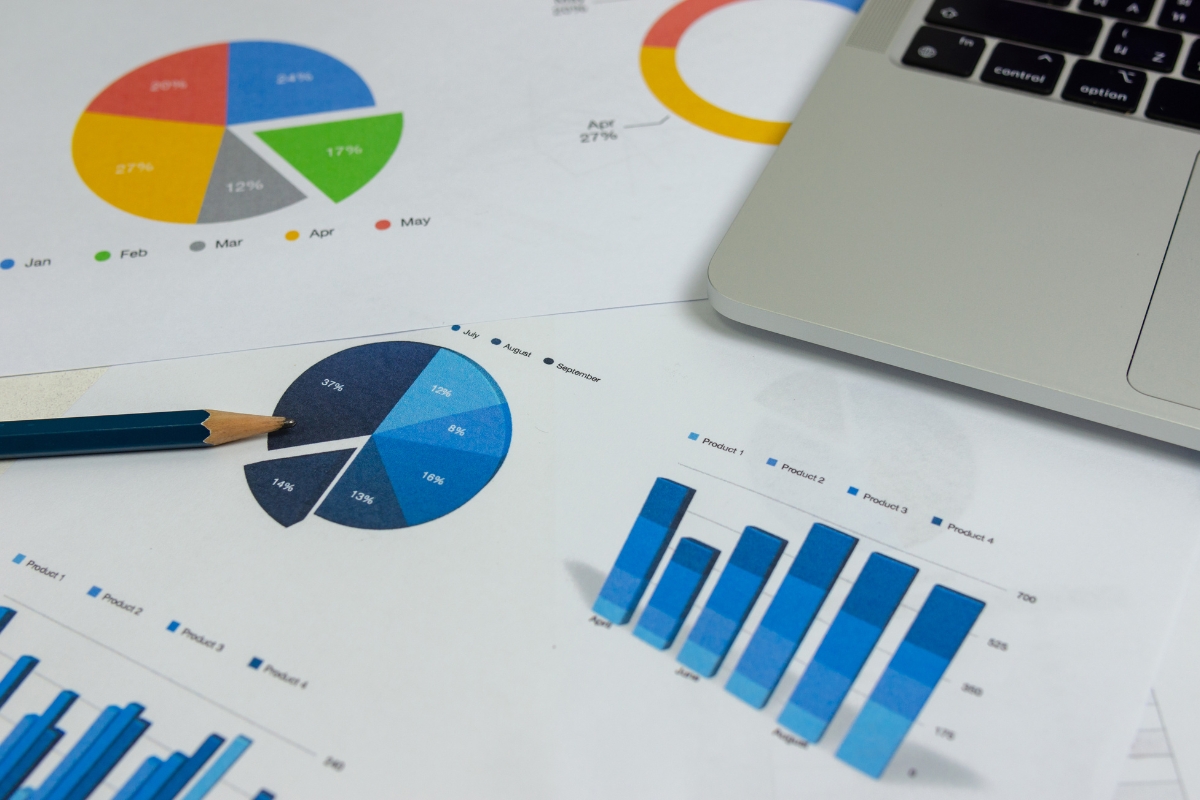
Businesses operating in Kenya can face growing amounts of operational information as they add customers, employees, products, services, systems, and transactions. Business dashboard development in Kenya can help organisations bring relevant information together and make it easier for managers to monitor performance across their operations. The value of a dashboard depends on how well it reflects the business’s processes, data sources, management requirements, and growth objectives:

1. Supporting Growing Businesses
Growing businesses often start with simple tools but may accumulate multiple spreadsheets, applications, and records as their operations expand. A dashboard can bring selected information from these sources into a more centralised management view, making it easier to monitor increasing activity. This can help businesses maintain visibility as their processes become more complex.
2. Connecting Disconnected Business Information
A business may use separate tools for sales, finance, customer management, inventory, websites, bookings, and internal operations. When these systems remain disconnected, employees and managers may have to check several platforms to understand what is happening. A dashboard can connect relevant information from these sources and present selected data together for easier monitoring.
3. Improving Operational Visibility
Managers need visibility into the activities that affect business performance. Dashboards can provide views of sales, customer activity, workflows, finances, inventory, enquiries, service delivery, or other relevant functions. This can make it easier to identify changes, delays, performance gaps, and areas that require management attention.
4. Supporting Data-Driven Management
Businesses may rely on assumptions or delayed reports when current operational information is difficult to access. A dashboard can provide consistent metrics based on available business data, giving managers a clearer basis for evaluating performance and responding to changes. This supports a more structured approach to management decisions without replacing professional judgement or business experience.
5. Supporting Multi-Department Operations
Businesses with several departments may need both department-specific information and an overall management view. A dashboard can provide different views for areas such as sales, finance, customer service, operations, or management while maintaining appropriate access controls. This allows each team to focus on relevant indicators while authorised managers can review broader business performance.
6. Supporting Business Growth
As a business grows, it may experience increases in users, transactions, customers, data volumes, locations, products, services, and operational processes. A well-planned dashboard can be designed to accommodate relevant changes and provide management visibility as complexity increases. This makes dashboard development more valuable when it forms part of a broader digital systems strategy rather than functioning as an isolated reporting tool.
How Much Does Business Dashboard Development Cost?
The cost of developing a business dashboard can vary significantly because dashboards differ in scope, data requirements, integrations, functionality, security, and technical complexity. A simple dashboard connected to a limited data source may require considerably less development work than a custom management system integrating multiple business applications and supporting many users. An accurate estimate therefore requires an assessment of the business requirements and the technical work needed to deliver the expected outcomes:

1. Dashboard Complexity
The complexity of the dashboard is one of the factors that can influence development effort and cost. A dashboard with a small number of straightforward metrics may require less work than one containing complex calculations, multiple views, advanced filtering, drill-down functionality, alerts, workflows, or other features. The required level of functionality should therefore be established before estimating the project.
2. Number of Data Sources
A dashboard may use information from one source or combine data from several systems. Connecting databases, spreadsheets, websites, CRM platforms, accounting systems, inventory applications, or other sources can increase the amount of analysis and development required. Each source may also have different data structures and access methods.
3. Integration Requirements
The method used to connect each data source can affect development requirements. Some systems may provide APIs or established integration options, while others may require different approaches to access and synchronise information. More complex integration requirements can increase development effort, testing needs, and ongoing maintenance considerations.
4. Number of Users
The number and types of dashboard users can affect the system architecture and access requirements. A dashboard used by a small management team may have different requirements from one used across multiple departments or locations. More users may also require more detailed permissions, authentication, role management, and performance considerations.
5. Data Volume
The amount of information the dashboard needs to process can influence its technical requirements. Large volumes of historical transactions or frequently updated records may require appropriate database structures, data processing methods, storage, and performance optimisation. The expected growth in data volume should also be considered when planning the system.
6. Dashboard Features
Additional functionality can affect the scope of development. Features may include interactive charts, filtering, drill-down views, KPI tracking, targets, comparisons, automated updates, alerts, notifications, exports, search, or customised reporting. The cost depends on which features are required and how they need to work with the underlying data.
7. Security and Access Requirements
Dashboards handling financial, customer, employee, or other sensitive information may require stronger security and more detailed access controls. Role-based permissions, authentication, data protection, audit requirements, and other security measures can add to the development scope. These requirements should be considered from the beginning rather than added after the system is built.
8. Customization and Design Requirements
The level of customisation can also affect development effort. A dashboard designed around specific business processes, metrics, workflows, terminology, user roles, and reporting requirements may require more work than a standard interface. The design should prioritise usability and the information managers need rather than focusing only on visual appearance.
9. Ongoing Support and Maintenance
Dashboard development does not necessarily end when the initial system is deployed. Connected applications may change, APIs may be updated, data structures may evolve, and businesses may require new metrics or functionality as their operations develop. Ongoing support, maintenance, monitoring, troubleshooting, security updates, and system improvements may therefore form part of the overall investment.
10. Future Development Requirements
Businesses should consider how the dashboard may need to evolve after the initial implementation. Future requirements could include additional data sources, departments, users, locations, metrics, integrations, automated workflows, or advanced reporting. Planning for these possibilities can influence the initial architecture and help reduce the risk of building a system that cannot accommodate future requirements.
What Challenges Can Businesses Face When Developing Business Dashboards?
Developing a business dashboard can involve more than selecting charts, metrics, and other visual elements because the quality of the final system depends heavily on the underlying data and business processes. Problems with data sources, requirements, integrations, access controls, or user adoption can reduce the usefulness of a dashboard even when its interface is well designed. Businesses should therefore address these challenges during planning and development rather than treating dashboard performance as a visual design issue alone:
1. Poor Data Quality
Inaccurate, incomplete, outdated, or duplicated records can produce misleading dashboard results. If the underlying information is unreliable, even correctly calculated metrics may give managers an inaccurate view of business performance. Data quality should therefore be assessed and improved before important information is used for management reporting.
2. Disconnected Data Sources
Business information may be distributed across separate applications, spreadsheets, databases, websites, and other systems. When these sources do not communicate effectively, bringing relevant information into one dashboard can become difficult. Businesses may need to assess available integration methods and determine which sources should be connected.
3. Inconsistent Data
Different systems may store similar information using different formats, names, units, categories, or definitions. For example, departments may use different methods to classify customers, calculate performance, or record transactions. These inconsistencies can affect dashboard accuracy unless the data is appropriately standardised and mapped.
4. Unclear KPIs
A dashboard can become difficult to use when businesses have not clearly defined what they want to measure. Including metrics simply because the information is available may create a collection of figures without a clear management purpose. KPIs should be linked to specific business objectives and responsibilities so users understand why each measure matters.
5. Excessive Information
Adding too many metrics, charts, tables, and indicators can make a dashboard difficult to interpret. Users may struggle to identify the information that requires attention when important measures are surrounded by unnecessary data. A useful dashboard should prioritise relevant information rather than attempting to display everything the business records.
6. Delayed Data Updates
A dashboard may provide limited value when the information displayed does not reflect the required level of currency. Delays can occur because of data-entry practices, integration limitations, scheduled synchronisation, or the way connected systems operate. Businesses should define appropriate update requirements based on how quickly the monitored information changes and how quickly managers need to act.
7. Integration Difficulties
Connecting a dashboard to existing systems can present technical challenges, particularly when applications have limited integration capabilities or use different data structures. APIs, databases, spreadsheets, legacy systems, and third-party applications may each require different integration approaches. These requirements should be assessed early so that technical limitations do not emerge unexpectedly during development.
8. Security and Access Issues
Dashboards can bring sensitive business information into one interface, increasing the importance of appropriate access controls. Financial information, customer records, employee data, and other confidential information may need to be restricted to specific users or roles. Authentication, permissions, data protection, and other security requirements should therefore form part of the dashboard architecture.
9. Low User Adoption
A technically functional dashboard may still provide limited value if employees and managers do not use it consistently. Users may reject a dashboard when it is difficult to understand, does not reflect their responsibilities, provides irrelevant information, or does not fit existing workflows. Involving relevant users during requirements definition and testing can help ensure that the final system supports actual business needs.
10. Lack of Ongoing Maintenance
Dashboard requirements and connected systems can change after deployment. Data sources may be modified, APIs may change, business processes may evolve, and managers may require new metrics or reports. Without appropriate maintenance and review, a dashboard can gradually become outdated or less reliable, reducing its value as a management tool.
How Can Businesses Ensure Their Dashboards Provide Useful Insights?
A useful dashboard should help users understand what is happening, why it matters, and where action may be required. Businesses can improve dashboard effectiveness by connecting the information displayed to clear objectives, selecting meaningful metrics, providing sufficient context, and ensuring that users can act on what they see. The goal is not simply to display more data but to create a management tool that turns relevant information into practical insight:

1. Focus on Business Objectives
Dashboard development should begin with the business objectives and management problems the system needs to support. These objectives provide a basis for deciding what information should be collected, which metrics matter, and what users should be able to monitor. Keeping the dashboard connected to clear objectives prevents unnecessary functionality and information from taking priority.
2. Select Relevant Metrics
The dashboard should focus on metrics that help users evaluate performance or make decisions. Relevant measures may include sales, revenue, customer activity, response times, workflow progress, costs, inventory, or other indicators depending on the business. Each metric should have a clear purpose rather than being included simply because the underlying data is available.
3. Avoid Unnecessary Data
More information does not automatically create better insight. Businesses should remove metrics and data points that do not contribute meaningfully to the decisions or responsibilities of dashboard users. A focused dashboard allows important changes and performance indicators to stand out more clearly.
4. Use Clear Visualizations
Charts, tables, indicators, graphs, and summary elements should make information easier to understand. The visual format should match the type of information being communicated and avoid unnecessary complexity. Clear presentation helps users interpret performance without spending excessive time working out what the dashboard is showing.
5. Provide Appropriate Context
A single number may not tell a manager whether performance is good, poor, improving, or declining. Dashboards can provide context by showing previous periods, targets, benchmarks, comparisons, trends, or related indicators. This allows users to interpret current results rather than viewing individual figures in isolation.
6. Set Meaningful Targets
Targets give managers a reference point for evaluating actual performance. Businesses should establish targets that relate to genuine objectives and can be measured consistently using available data. Comparing actual results with meaningful targets can help users identify performance gaps and determine where further investigation may be required.
7. Give Users Relevant Access
Users should have access to the information required for their responsibilities without unnecessarily exposing information that they do not need. Role-based access can provide department-specific views while allowing authorised managers to access broader information. This improves usability while supporting appropriate information security.
8. Review Dashboard Performance
Businesses should periodically assess whether the dashboard is still providing accurate, relevant, and useful information. This review can examine data quality, update performance, user activity, system reliability, and whether the displayed metrics continue to support management decisions. Regular evaluation helps identify issues before they significantly reduce the dashboard’s value.
9. Update Metrics as Business Needs Change
Business objectives, processes, customers, products, and operating conditions can change over time. Metrics that were useful when a dashboard was first developed may become less relevant as the organisation evolves. Reviewing and updating the dashboard’s KPIs and functionality helps keep the system aligned with current management requirements.
10. Connect Insights to Action
A dashboard becomes more valuable when the information it presents leads to appropriate management action. Users should be able to identify a change, understand its significance, investigate relevant details, and determine what response may be necessary. This creates the complete progression from data to information, information to insight, and insight to action, rather than leaving the dashboard as a passive display of business figures.
How Can Smepal Consultancy Agency Help With Business Dashboard Development in Kenya?
Businesses need more than attractive charts to turn operational data into useful management information. Smepal Consultancy Agency approaches business dashboard development in Kenya as part of a broader digital systems strategy, focusing on business requirements, data, integrations, users, and the decisions the system needs to support. Our role is to help businesses determine the appropriate digital approach and develop solutions that provide practical management value as their operations evolve:
1. We Start With Your Business Requirements
We begin by understanding the management objectives, operational problems, users, decision-making needs, and expected outcomes that should guide the dashboard. This helps establish what the system needs to accomplish before decisions are made about features or visual presentation. Starting with requirements keeps the development process focused on business value rather than technology alone.
2. We Identify Relevant Business Data
We assess the information the business already generates and where that information is stored. This may include databases, business software, websites, spreadsheets, applications, and other operational data sources. Understanding the available information helps determine what can be used for dashboard metrics and what may require additional data processes.
3. We Define the Right Dashboard Metrics
We help identify KPIs, performance indicators, targets, operational measures, and other management information that are relevant to the business. The goal is to avoid filling the dashboard with unnecessary figures and instead focus on information that supports specific decisions and responsibilities. The selected metrics should also be based on data that can be measured consistently.
4. We Consider Data Integration
We assess how relevant information can move between the dashboard and existing systems. Depending on the business environment, this may involve APIs, databases, existing software, websites, spreadsheets, or other information flows. Considering integration requirements early helps establish a practical technical approach and reduces the risk of disconnected information.
5. We Consider Security and User Access
We consider how different users should access dashboard information based on their roles and responsibilities. This includes user roles, permissions, sensitive information, data protection, and appropriate access levels. These requirements help ensure that users can access the information they need without unnecessarily exposing restricted business data.
6. We Focus on Useful Management Insights
The purpose of the dashboard is to help management understand and act on relevant information. We focus on areas such as operational visibility, performance monitoring, trend identification, problem detection, and decision-making when defining what the system should provide. This helps distinguish a management dashboard from a system that simply displays large amounts of data.
7. We Consider Scalability
Dashboard requirements can change as a business grows and adds more users, data, departments, systems, locations, or processes. We consider these potential changes when assessing the appropriate digital approach and system requirements. This can help businesses avoid developing a solution that becomes unsuitable as operational complexity increases.
8. We Help Determine the Appropriate Digital Approach
Not every business requires the same type of dashboard solution. Depending on the requirements, the appropriate approach may involve a standalone dashboard, an integrated dashboard, existing reporting tools, a custom dashboard, or a combination of systems. We consider the business needs, available systems, data requirements, and expected outcomes when determining which approach is most appropriate.
9. We Support the Dashboard Development Journey
Dashboard development can involve requirements gathering, data assessment, planning, development, integration, implementation, testing, and ongoing improvement. We approach these activities as connected parts of a digital systems development process rather than treating the dashboard as an isolated visual product. This allows the solution to remain aligned with the business requirements and operational needs established at the beginning.
Frequently Asked Questions About Business Dashboard Development in Kenya
Businesses often have questions about what dashboards can do, which systems they can connect to, how much development may involve, and how the technology can support their operations. Understanding these considerations can help organisations determine whether a dashboard is appropriate and what requirements should be defined before development begins. The following answers address common questions about business dashboard development in Kenya:
1. What Is a Business Dashboard?
A business dashboard is a digital interface that brings selected business information into one view using metrics, charts, tables, indicators, and other visual elements. It can help authorised users monitor performance, operational activities, trends, and other information relevant to their responsibilities.
2. What Is Business Dashboard Development?
Business dashboard development is the process of planning, designing, building, integrating, testing, and implementing a dashboard around specific business requirements. It can involve connecting data sources, defining KPIs, developing functionality, configuring access controls, and creating views that help users monitor and understand business information.
3. How Do Business Dashboards Turn Data Into Insights?
Dashboards collect relevant information from connected data sources, organise it around meaningful metrics, process and update the information, and present it through understandable visual elements. Users can then compare results, identify trends or exceptions, investigate issues, and use the information to support management decisions.
4. What Information Can a Business Dashboard Display?
A dashboard can display information such as sales, revenue, customers, enquiries, bookings, workflows, finances, inventory, employees, productivity, website activity, customer service, and other operational data. The information included should depend on the business objectives, available data, user requirements, and decisions the dashboard needs to support.
5. Can a Business Dashboard Connect Multiple Systems?
Yes, a dashboard can be designed to connect relevant information from multiple systems where the required integration methods are available. These may include databases, CRM platforms, accounting software, inventory systems, websites, spreadsheets, APIs, and other applications.
6. Can Business Dashboards Show Real-Time Data?
A dashboard can provide real-time or near-real-time information when the relevant data source, integration architecture, and update process support that level of currency. Not every system can provide instant updates, so the actual update frequency depends on the connected systems, integration method, data processing, and business requirements.
7. What Businesses Need Business Dashboards?
Businesses that need to monitor performance, operations, customers, finances, workflows, or other changing activities may benefit from dashboards. They can be particularly useful for growing or multi-department organisations that manage information across several systems and need a more coordinated management view.
8. How Much Does Business Dashboard Development Cost in Kenya?
There is no single appropriate price because development requirements vary between businesses. Cost can depend on dashboard complexity, data sources, integrations, users, data volume, features, security requirements, customisation, support, and future development needs, so an accurate estimate requires understanding the required solution.
9. How Long Does It Take to Develop a Business Dashboard?
The development timeframe depends on the scope and complexity of the dashboard. A solution with limited data sources and straightforward requirements may require less development work than a custom system involving multiple integrations, complex metrics, advanced functionality, security requirements, and extensive testing.
10. Can a Business Dashboard Integrate With Existing Software?
Yes, a dashboard can potentially integrate with existing software when the relevant system provides a suitable way to access or exchange information. The available options may include APIs, database connections, data imports, or other integration methods depending on the software architecture and requirements.
11. Can Business Dashboards Be Customized?
Yes, business dashboards can be customised around specific metrics, users, business processes, data sources, access requirements, visual presentations, and reporting needs. Customisation allows the dashboard to reflect how the business operates rather than forcing users to work with a generic set of indicators.
12. Are Business Dashboards Secure?
A business dashboard can incorporate appropriate security measures such as authentication, role-based permissions, restricted access, data protection, and other controls relevant to the system. The level of security required depends on the information being handled, the connected systems, the users, and the business’s specific requirements.
13. Can Different Employees Have Different Dashboard Access?
Yes, dashboards can be designed with role-based access so that different employees see information appropriate to their responsibilities. For example, a sales employee may access sales-related information while authorised management users may have access to broader business performance data.
14. Can Business Dashboards Be Developed in Phases?
Yes, dashboard development can be approached in phases when the business prefers to prioritise important requirements first. An initial phase may focus on core data sources and KPIs, while later phases can introduce additional integrations, departments, features, users, or reporting capabilities as requirements develop.
15. How Does Smepal Consultancy Agency Approach Business Dashboard Development?
Smepal Consultancy Agency approaches dashboard development as part of a broader digital systems strategy. We focus on understanding business requirements, identifying relevant data, defining useful metrics, considering integrations and access requirements, and determining how the resulting system can support operational visibility and management decisions.
16. Can Smepal Consultancy Agency Develop a Custom Business Dashboard?
Yes, Smepal Consultancy Agency can help businesses assess and develop a custom dashboard approach based on their operational requirements, data sources, integrations, users, metrics, and expected outcomes. The appropriate solution depends on the business context, so the development process begins by understanding what the organisation needs the dashboard to achieve.
Choose Smepal Consultancy Agency for Business Dashboard Development in Kenya Today!
Before investing in a dashboard, identify the operational data, management problems, users, KPIs, integrations, security requirements, and expected outcomes that the solution needs to address. Smepal Consultancy Agency can help you determine whether your business needs a custom dashboard, an integrated dashboard, existing reporting tools, or a combination of digital systems based on your requirements. Our strategic approach focuses on connecting relevant data, delivering useful management insights, defining a clear development scope, controlling investment, and creating a solution that remains valuable as your business grows. Contact Smepal Consultancy Agency today to discuss your business dashboard requirements and determine the right digital systems approach for your organisation.